Enervee Score®
Your score. Your planet.
Turning energy savings into a simple 0-to-100 score.
With its proven ability to guide shoppers towards highly efficient purchases, the Enervee Score transforms energy and carbon savings into a practical and easy-to-understand 0-to-100 score.

It's all relative.
Calculated daily for thousands of models across more than 40 product categories, the Enervee Score shows the relative efficiency of a product compared to all other products in the category, enabling shopper to instantly see and understand the model-specific energy performances and carbon emissions for any possible purchase.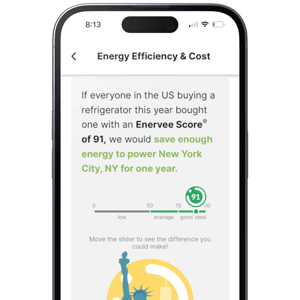

People choose more efficient products (12% more efficient TVs in one study) when the Enervee Score is present.
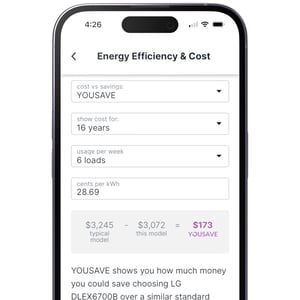
Super-efficient purchases unlock long-term energy savings across the lifetime of the product.
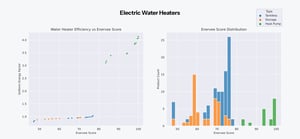
Calculating the Enervee Score.
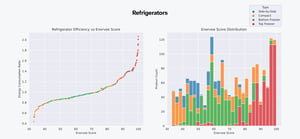
The higher the Enervee Score, the more efficient that product is, relative to all other relevant products in its category. Normalized across categories, the Enervee Score enables consumers to instantly see and understand the model-specific energy performances for any possible purchase. The Enervee Score is also reviewed and refreshed daily - for every product category.
The Enervee Score provides market transparency when it comes to product energy usage and carbon emissions. Using the full range of the 0-100 scale, the Enervee Score maps every product with their specific score. All but the best 10% of products score between 0 and 90 on the Enervee Score scale, with specific bands for easy recognition: Low (0-50), Medium (50-75) and High (75-90). For the top 10% of products in each category, we reserve the Enervee Score range of 90-100. Top-performing products score 90-100 (Ideal), making it easier still to pick the ideal products and appliances for your home.