
Platform · Choice Engine® & Enervee Score®
The Enervee Score rates every model. The Choice Engine ranks every choice.
The Enervee Score is a 0–100 rating of a product's energy efficiency relative to every other model on sale in its category, recalculated as the market changes. The Choice Engine uses it to rank and present the efficient option first. In four of four studies, showing the Score raised the efficiency of what people bought; the effect was strongest among lower-income shoppers.
- 40+
- product categories, recalculated daily
- 0–100
- normalised — a 90 means the same on every category
The top 10% of the category. Reserved for the best-performing models on the market today.
One system
Relative by design. Ranked by default.
The Enervee Score® rates a product against every other model in its category, recalculated daily across more than 40 categories. The Choice Engine® then orders the results by Score, price and available incentives — so the efficient option is the one in front of the shopper, not the one they have to go looking for.
-
Rated 0–100
Every model in a category scored against every other, normalised so a 90 means the same on a refrigerator as on a television.
-
Ranked in context
The Choice Engine® weighs efficiency, price and available incentives together, so the best real option surfaces without the shopper sorting for it.
-
Choices shift
People choose more efficient products when the Score is present — measured in peer-reviewed trials, with the largest effect among low-income shoppers.
Methodology
Calculating the Enervee Score.
The higher the Enervee Score, the more efficient that product is, relative to all other relevant products in its category. Normalized across categories, the Enervee Score enables consumers to instantly see and understand the model-specific energy performances for any possible purchase. It is reviewed and refreshed daily — for every product category.
Using the full range of the 0–100 scale, the Enervee Score maps every product with its specific score. All but the best 10% of products score between 0 and 90, with specific bands for easy recognition. For the top 10% of products in each category, we reserve the 90–100 range — Ideal — making it easier still to pick the best appliance for the home.
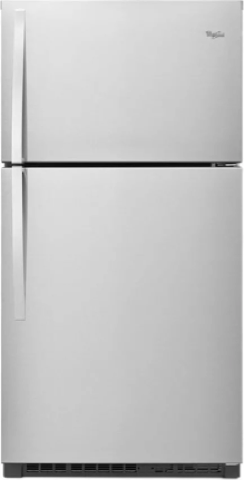 91
91
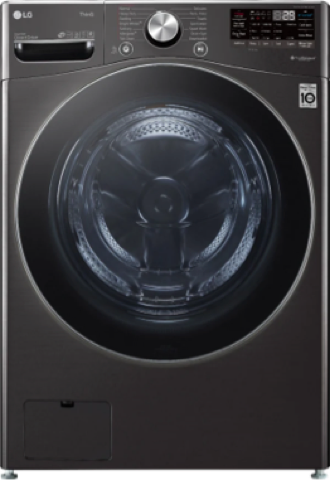 94
94
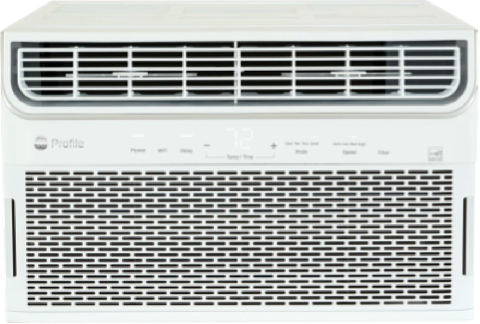 88
88
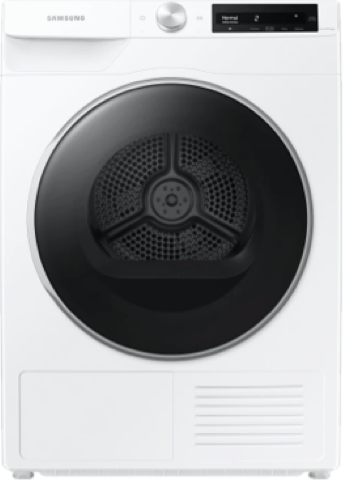 92
92
 94
94
Ideal (90–100) is always the top 10% of the category. Bars follow the live category distributions on choose.enervee.com, September 2026.
By category
Enervee Score methodology for each product category.
Enervee follows the appropriate and accepted standards on performance and energy efficiency ratings in each territory where used. For categories that are not regulated by standards — video game consoles, for instance — Enervee collaborates with stakeholders to develop and agree on its own methodology.
-
Heating & Cooling
Air conditioners
BTUs of cooling power per watt.
Shop now → -
 Heating & Cooling
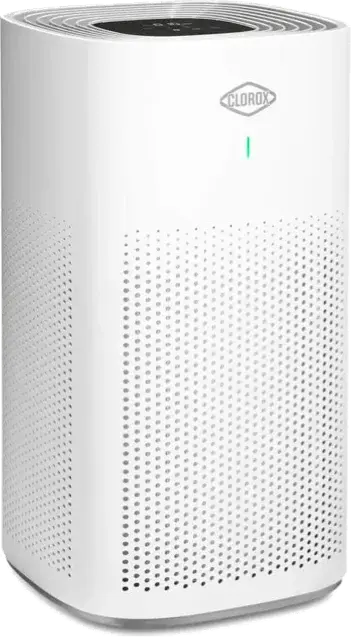
Air purifiers
Clean air delivery rate per watt.
Shop now → -
 Heating & Cooling
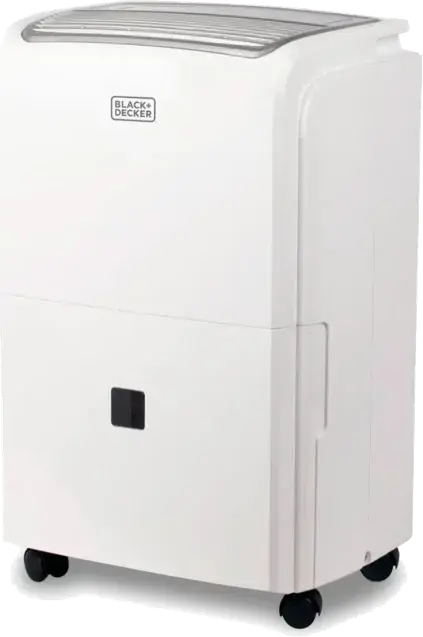
Dehumidifiers
Litres of water removed per kWh.
Shop now → -
 Heating & Cooling
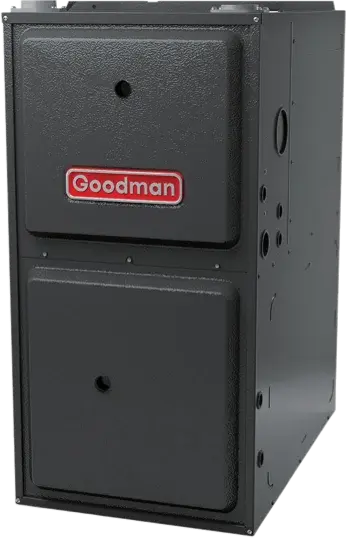
Gas furnaces
Heating energy output per unit of input fuel energy.
Shop now → -
 Heating & Cooling
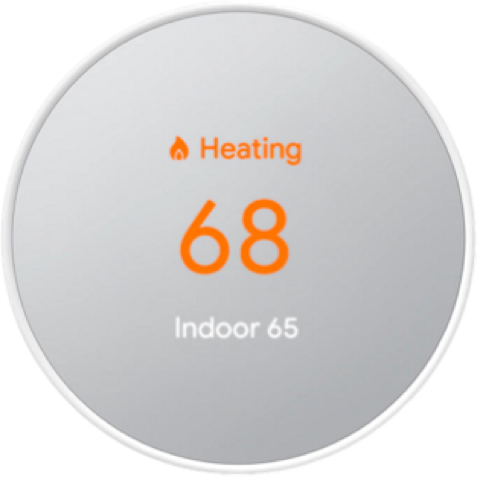
Thermostats
Energy savings realised per kWh.
Shop now → -
Heating & Cooling
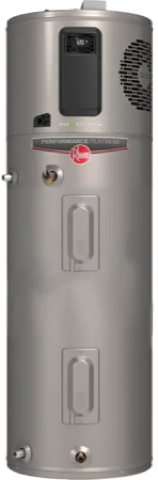
Electric water heaters
Heat delivered to water per kWh.
Shop now → -
 Heating & Cooling
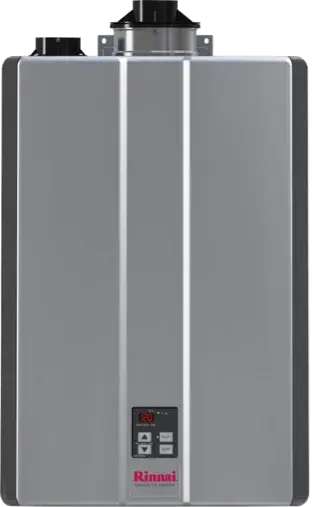
Gas water heaters
Heat delivered to water per therm.
Shop now → -
Laundry
Clothes washers
Cubic feet of volume per kWh per cycle.
Shop now → -
Laundry
Electric dryers
Pounds of clothes dried per kWh.
Shop now → -
 Laundry
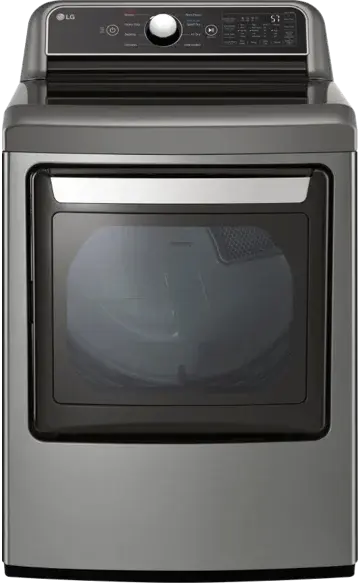
Gas dryers
Pounds of clothes dried per therm.
Shop now → -
 Kitchen
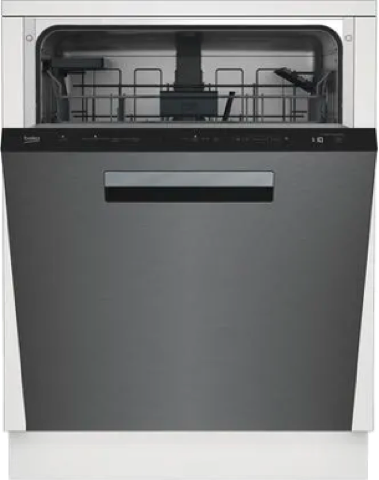
Dishwashers
Dishwashing cycles per kWh.
Shop now → -
Kitchen
Refrigerators
Capacity in cubic feet and kWh per year.
Shop now → -
 Kitchen
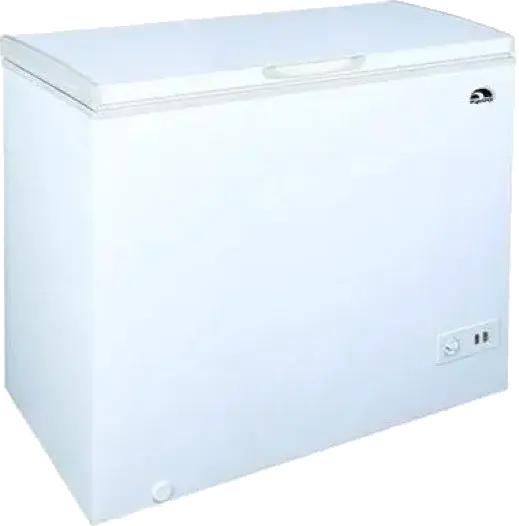
Freezers
Capacity in cubic feet and kWh per year.
Shop now → -
 Transportation
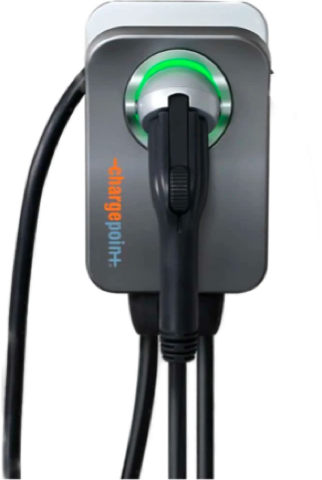
EV chargers
Energy savings relative to a low-efficiency baseline.
Shop now → -
 Entertainment
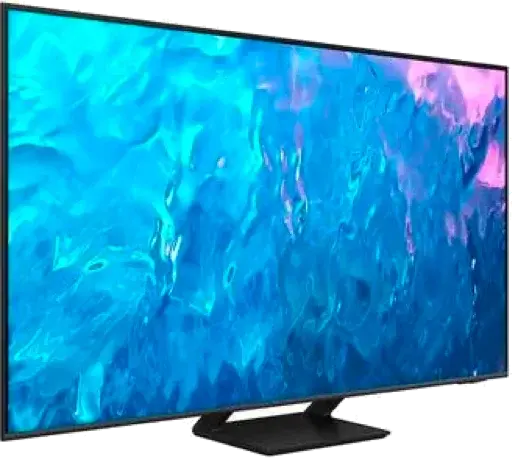
Televisions
Screen size (diagonal in) and kWh per year.
Shop now → -
 Entertainment
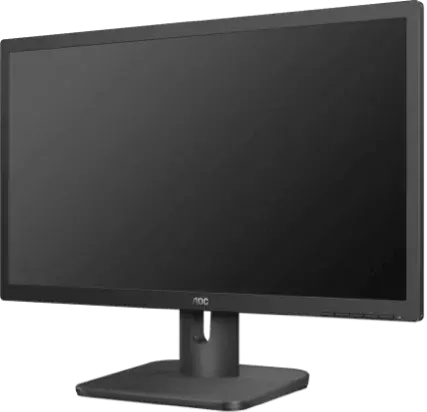
Monitors
Screen size (diagonal in) and kWh per year.
Shop now → -
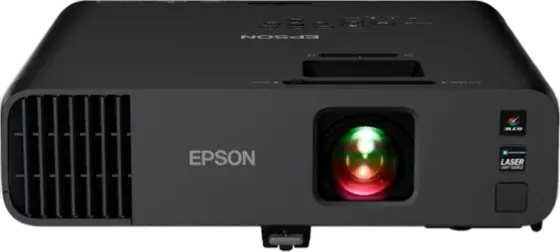 Entertainment
Projectors
Lumens of brightness and kWh per year.
Shop now → -
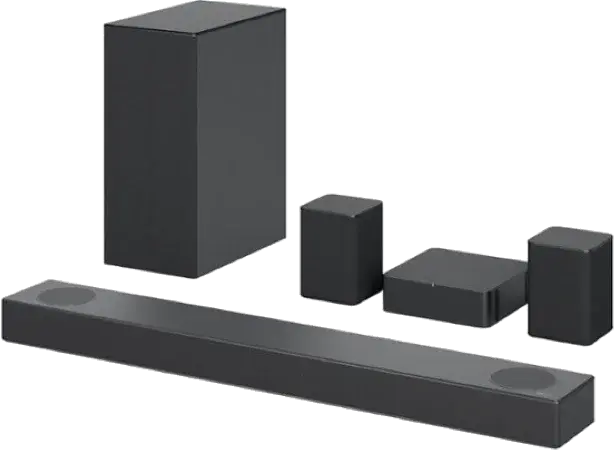 Entertainment
Sound bars
Power consumption across modes.
Shop now → -
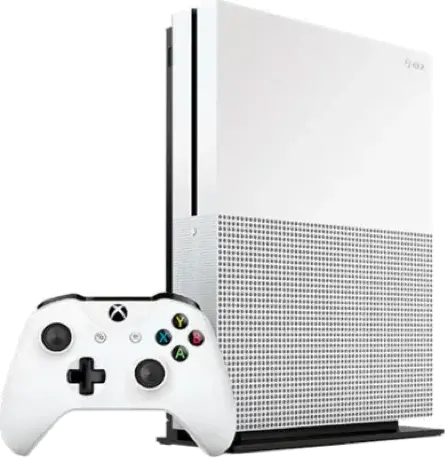 Entertainment
Game consoles
Performance (CPU, memory, storage) and kWh.
Shop now → -
Entertainment
Tablets
Performance (screen, CPU, memory) and kWh.
Shop now → -
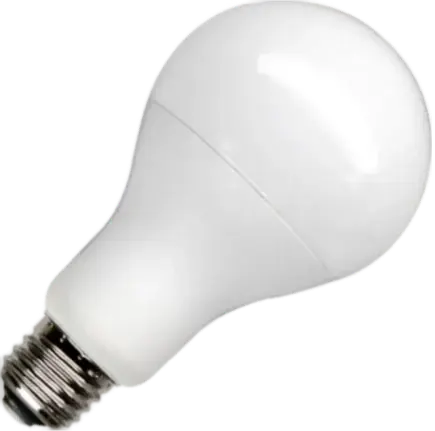 Lighting
Light bulbs
Lumens of brightness per watt.
Shop now → -
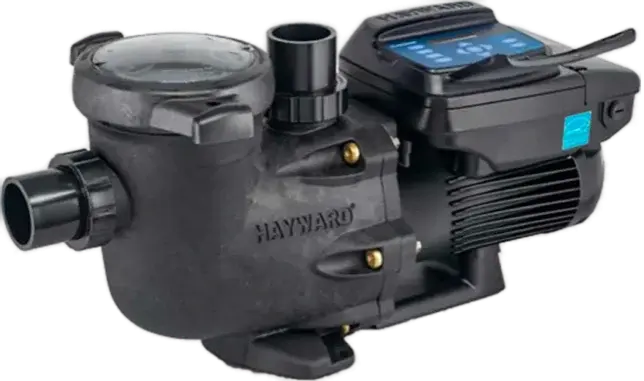 Pool
Pool
Pool pumps
Flow rate in gal/hr and energy factor in gal/kWh.
Shop now →
Peer-reviewed
Showing the Score changes what people buy.
Across three randomised controlled trials of 200 respondents each, showing the Enervee Score raised the average Score of the product chosen from 85.5 to 89.5 — a significant shift, and the largest effect was among low-income shoppers.
Read the paper in Energy Efficiency (open access) →Average Enervee Score of the product chosen · 3 RCTs · n=200 each