As 2018 grabs its hat, says its farewells and hurtles towards the exit at breakneck speed, there’s lots to reflect on in what has been a rollercoaster year — good, bad and ugly. We’ll leave the full year-end reviews to others, but we wanted to share our own highlights on the year that went by the name-both formally and informally — of 2018. For Enervee, it’s been a year of more thrills, spills and action than a team-building away-day with Matt Damon, Jason Statham and the entire Avengers team — with Dwayne Johnson driving the minibus.
Here’s Enervee’s 2018 in numbers. As it’s Christmas, we’ve chosen our top 12.

1. 53 million
By the close of 2018, Enervee’s IDEAL Customer Platform has been adopted by utilities across the US and Europe who have a combined number of households that numbers 53 million. That’s 53 million opportunities to change buying behavior across a range of purchase decisions. And did we say we know the Enervee Score is both highly relevant for consumers, and proven to influence preferences towards significantly more efficient choices when visible?

2. 14
With the IDEAL Customer Platform now deployed across 14 utilities (including all major utilities in California, and Europe’s largest), 2018 saw Enervee notch up almost four million visits for its partners by the close of the year.
3. 545,780
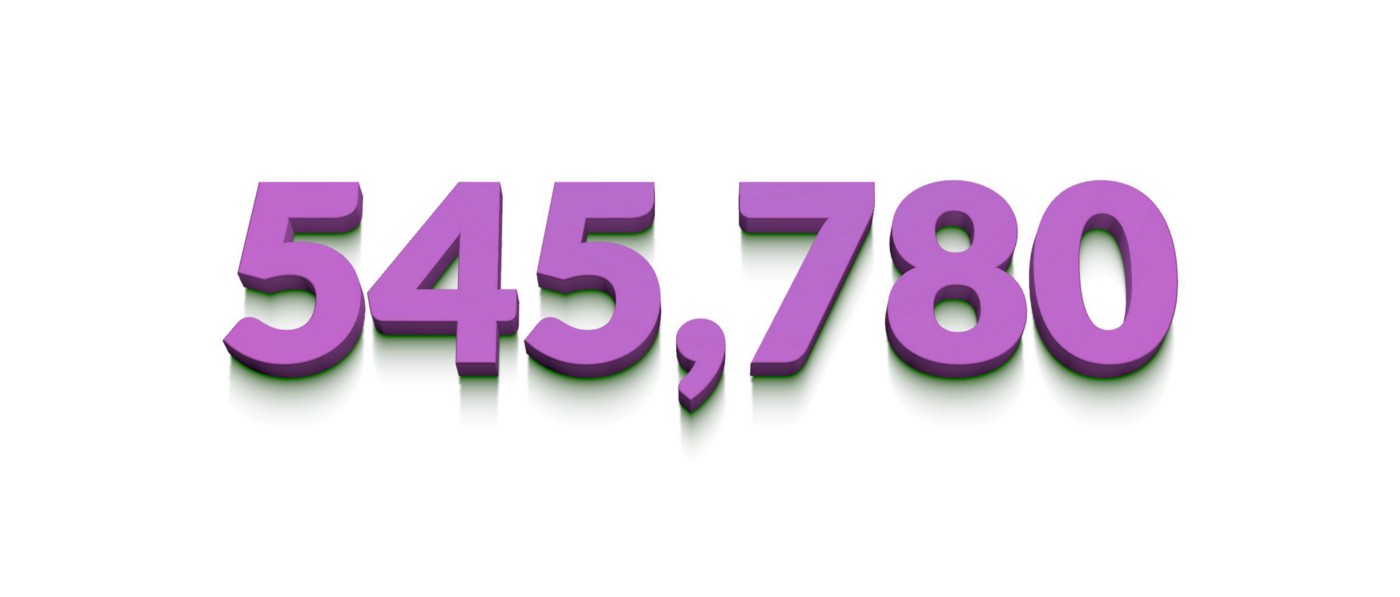
September may signal the end of the summer for most people. But for Enervee it represented the single biggest month for total visits to its IDEAL Marketplaces for utility partners. 545,780, to be precise.

4. 91 seconds
It’s often heard that energy companies have an uphill battle to engage their customers, with contact time precariously low. Enervee has proven again in 2018 that its Choice Engines represent an excellent opportunity to meaningfully engage — users spend on average 1.5mins interacting with the platform per visit.

5. 2
A small number? We don’t think so. 2018 saw Enervee launch its cars choice engine (Enervee Cars). Designed specifically to engage all car buyers in the merits of owning an EV, and featuring Enervee’s unique feature, the Enervee Score, Enervee Cars went from concept to two full deployments in 2018. Thanks to National Grid and Con Edison for leading the EV charge.

6. 43,900
Now this is a big number by anyone’s measure. Even more so when we tell you it represents the number of products analyzed and scored within Enervee’s Choice Engines. More precisely, that’s 40,000 appliances and home products for Appliances and Lighting, and 3900 cars for Cars. Washers, dryers, E14s and hatchbacks…you’ve nowhere left to hide…

7. 17.2 million
But this is an even bigger number. And it’s the number of price verifications and updates run across the IDEAL Customer Platform over the year. What does it mean? It means shoppers can always be confident they’re getting the most efficient products at the best prices, when they use their utility’s IDEAL Marketplace.
8. 337, 078
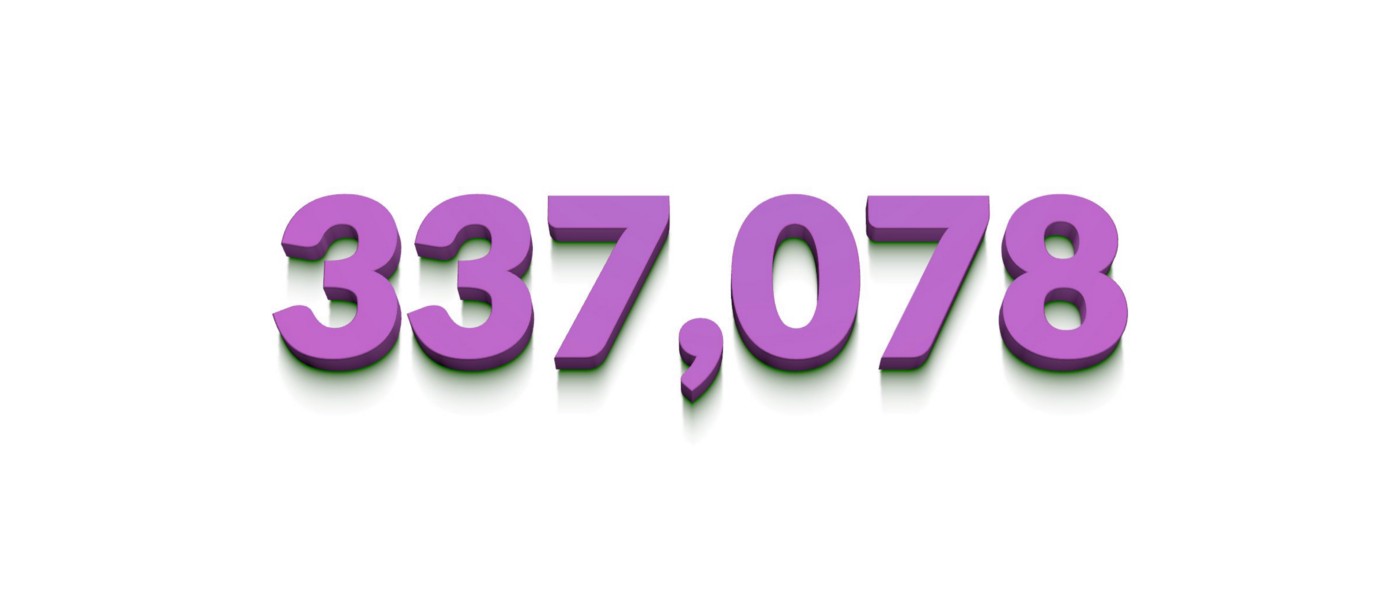
The IDEAL Marketplace features unique data that make the market transparent for shoppers — the Enervee Score (0–100), ClearCost (personalized total cost of ownership) and YouSave (personalized lifetime financial savings from making the right choice). But do shoppers actually use these features? Yes — throughout 2018, over 1/3 million shoppers actively interacted with these features on Marketplace.

9. 6576 & 30
Two numbers. Same message. These represent the total number of products that have carried an Enervee Score of ‘90+’ across Enervee’s Choice Engines, throughout 2018. More precisely, that’s 6576 ‘90+’ products on Appliances, and 30 ‘90+’ cars on Cars. Not many is it? Which is why it’s vital we as shoppers have the information to hand in order to make the best choice. Plus we know — from our RCTs — that we as consumers, when we have the choice to choose, rather than pick — do so. Our studies support the argument that given the right information, at the right time, we make better choices.
10. 158GWh — 434GWh
‘What is really really really surprising, is that the largest amount of savings are associated with Marketplace alone.’ Dr Todd Malinick, Research Into Action.
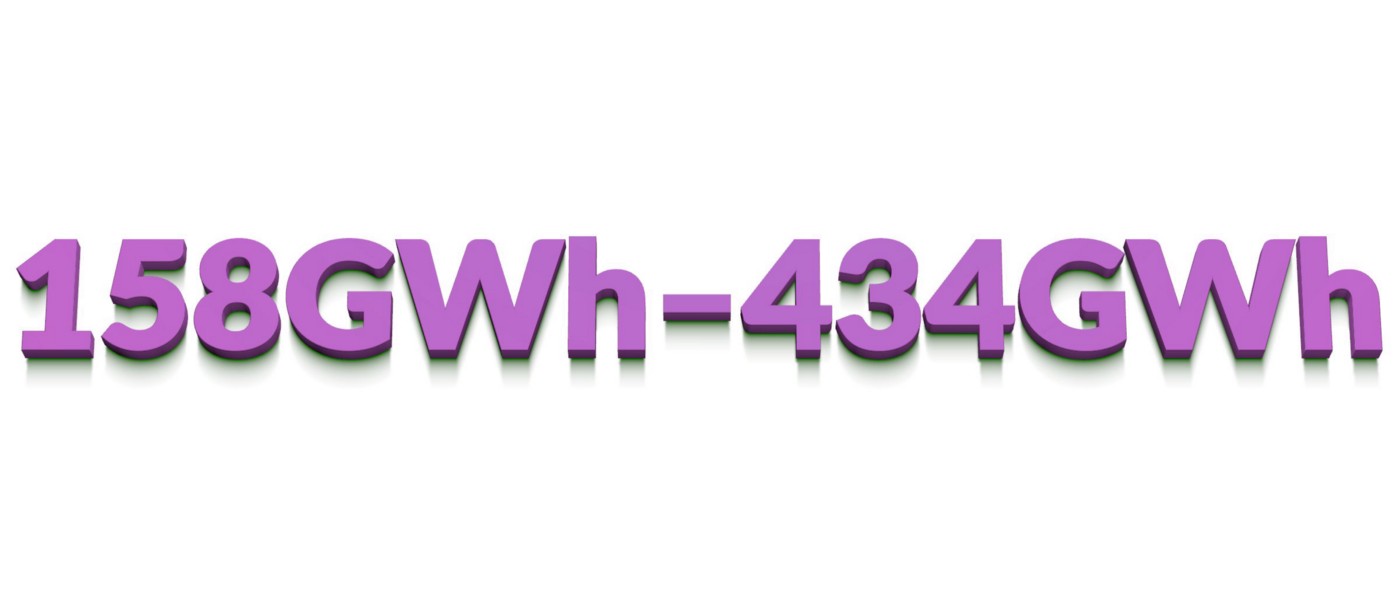
2018 saw Research Into Action publish its independent assessment into PG&E’s IDEAL Marketplace, provided by Enervee. And what a report it was. It found that 10% of PG&E customers had used the PG&E Marketplace (with no meaningful marketing budget), and that 78% of users found the Enervee Score the most useful feature (the number one feature of the platform, with ClearCost and Yousave being a hit with 62% and 69% of users, respectively). It found that for each PG&E Marketplace visitor, lifetime savings would add-up to $300 per visit, as a result of lifetime savings of 995 kWh and 52 therms of energy on average. And it also found that 75% of electricity savings and 89% of natural gas savings documented were attributable purely to the behavioral strategies embedded in the design of the platform. That means no mid- or downstream incentives needed — just shoppers exercising their new-found ability to truly choose, rather than pick. And as for those numbers of 158GWh — 434GWh? Research Into Action claim PG&E Marketplace helped shoppers save this much electricity on a gross lifetime basis. And let’s say it again — all through the behavioral design within the platform, without an incentive dollar in site.
11. 1.36% vs. 45%
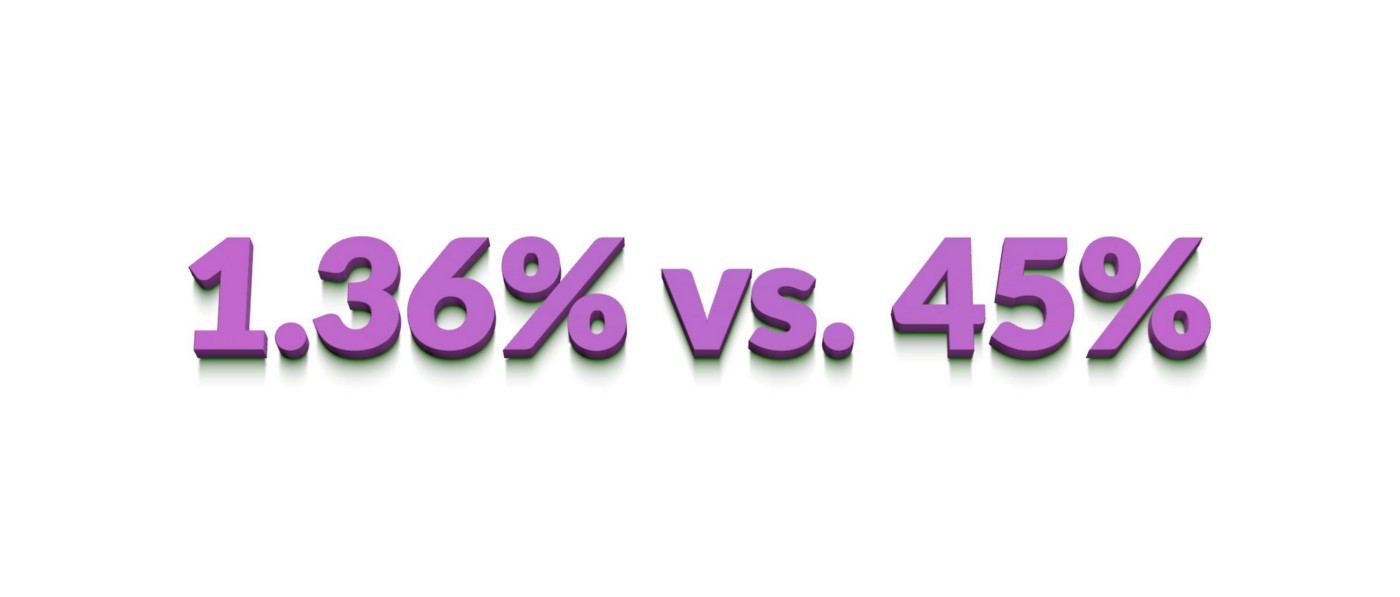
Only 1.36% of NY car shoppers are actively in the market for an EV. Yet we know from Enervee’s consumer research that the clear majority of car buyers are keen to buy one that is cheap to run, and has low emissions. So the challenge is to get conventional ICE car shoppers to realise these features pretty much define an EV. In trials on Enervee Cars, we found the behavioral design of the platform (based on the Enervee Score) was able to engage 45% of active site users to engage with a viable EV alternative when they’d started their search looking for a conventional ICE. Last time we checked, 45 is considerable bigger than 1.36. Choice Engines to the rescue. Again.
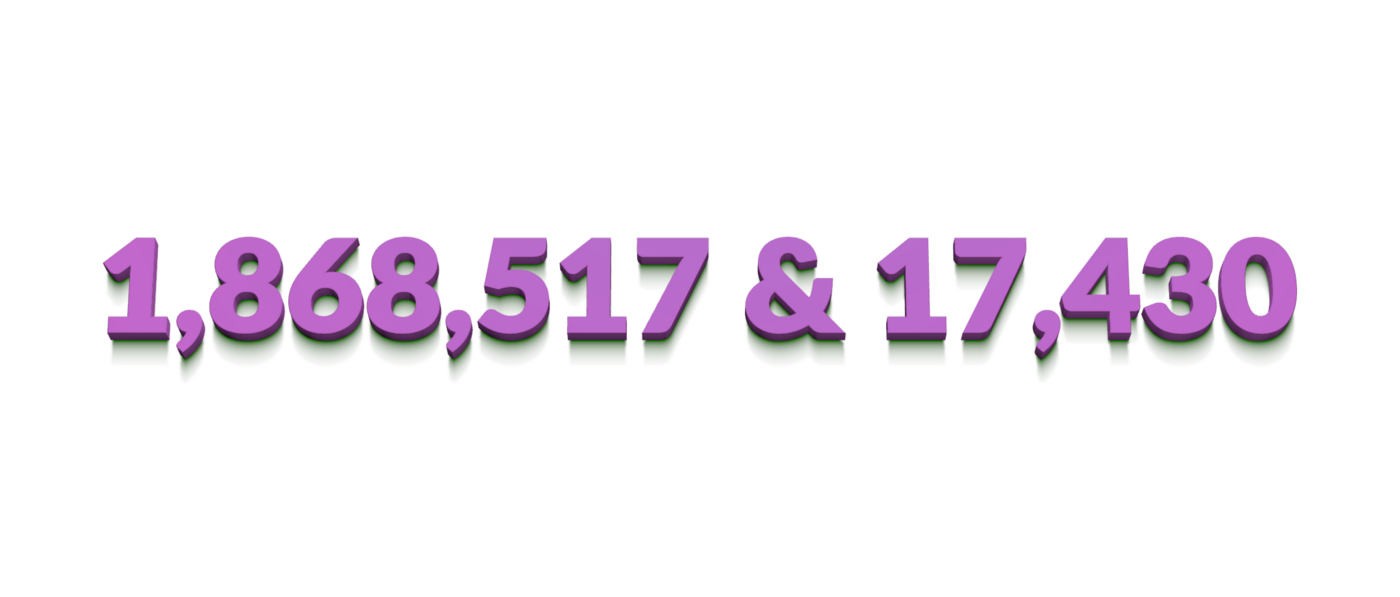
12. 1,868,517 & 17,430
All of this success doesn’t come out of thin air of course. Team Enervee has toiled long and hard over 2018 to deliver these results. Two numbers tell us how hard the team has worked. The first number — 1,868,517 — is the total number of Slack messages sent within the team in 2018. That boils down to almost 8000 exchanges a day. And to fuel that Slack veracity is the second number — the Enervee team worked their way through 1743 protein bars during the year. That’s half a million calories and, at 10g of protein a bar, just shy of 18kgs of protein, all devoured in the name of delivering more energy-smart buying decisions. Dwayne would be proud. As are we.
Merry Christmas to all those who have supported Enervee in 2018. And here’s to an even more impressive 2019.
